Each report includes controls that enable you to view, reorganise, and filter displayed information, so you can quickly identify and investigate invoice issues in your account.
The available controls depend on the report type:
- KPI (Key Performance Indicator) Reports: Text-only reports that provide information about core invoice issues
- Chart Reports: Chart/graph-based reports that visualise invoice information
KPI (Key Performance Indicator) Reports
KPIs are text-only reports that include information about a core aspect of your invoicing (e.g. the number of pending invoice errors in your account).
The Transaction Dashboard includes two KPI reports by default:
- Duplicate Invoice Pairs Pending: Number of potential duplicate invoices awaiting resolution
- Invoice Errors Pending: Number of invoices with errors awaiting resolution
 You can select information in the KPI report to open a filtered view of the Duplicate Invoices or Invoice Errors tab with additional report information.

To narrow the displayed information in a KPI report:
Set a Date Range
The date filter enables you to define a date range for the reported values:
Note: There is no limit on the length of the selected date range.
- In the upper-right corner of the report, click the calendar icon to display the filter.
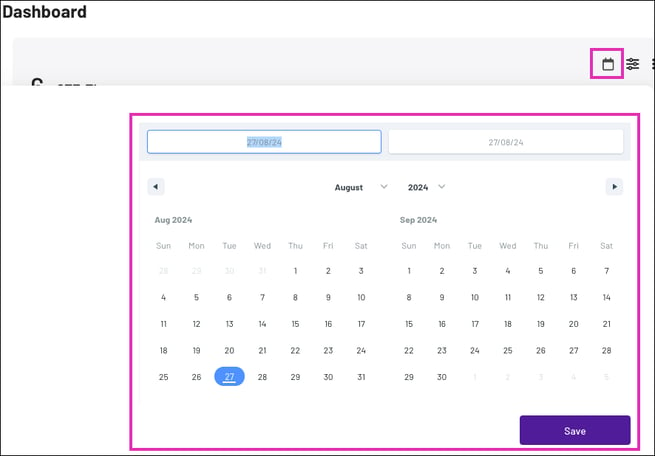
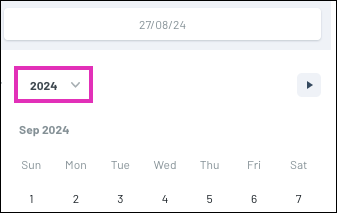
- Click the year dropdown to select a year for the date range.
- Do one of the following to select a starting month for the range:
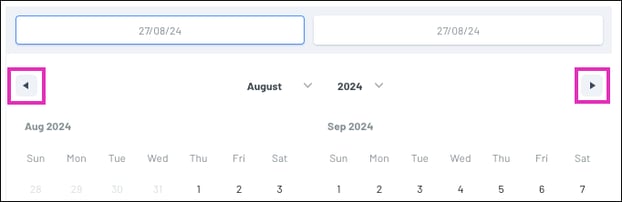
- (Optional) Click the left and right arrows to navigate to the starting month.
- Click the month dropdown to select a starting month for the date range.
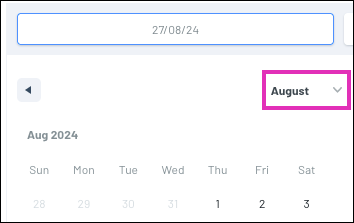
- (Optional) Click the left and right arrows to navigate to the starting month.
- Select a start date, then an end date.
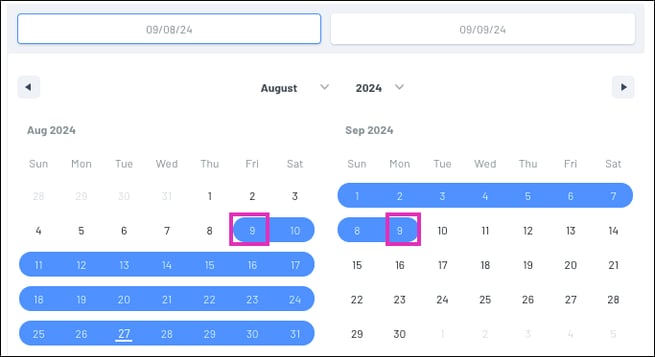
- Click Save to apply the date range and close the pop-up. The report updates immediately to reflect the selected timeframe.
Apply Filters
The KPI reports include the following filters, which you can use to narrow the displayed information:
- Region: Geographical mapping area for the company associated with the invoices
- System: System where the invoices originated (e.g., workflow, ERP, etc.)
- Vendor Groups: Vendor groups that issued the invoices
- Currency: Currency for the owed invoice amounts
Note: When you select report values to drill down on the information, the detailed view adheres to any filters you applied to the report.
To apply a filter:
- At the top-right of the report, click the filter icon to display the filter pop-up.
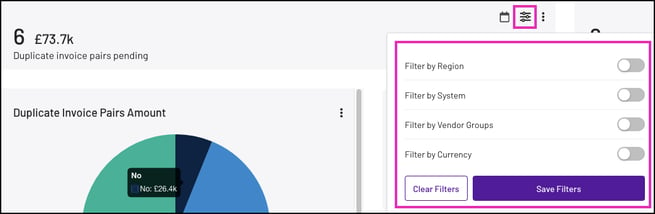
- Enable the filter you want to use. This displays a dropdown where you can configure the filter.
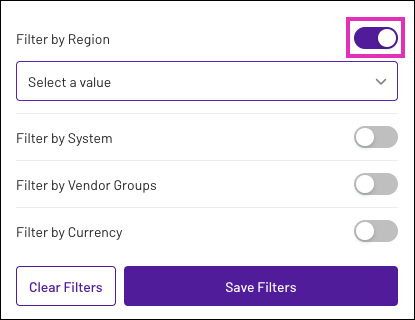
- Click the dropdown and select the desired filter options.
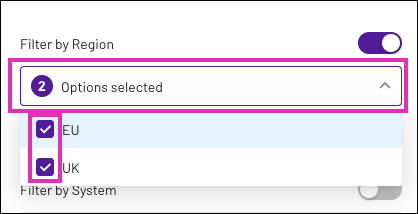
- Click within the filter pop-up (but outside the dropdown) to close the options dropdown.
- Click Save Filters to apply the filters and close the pop-up.
Chart Reports
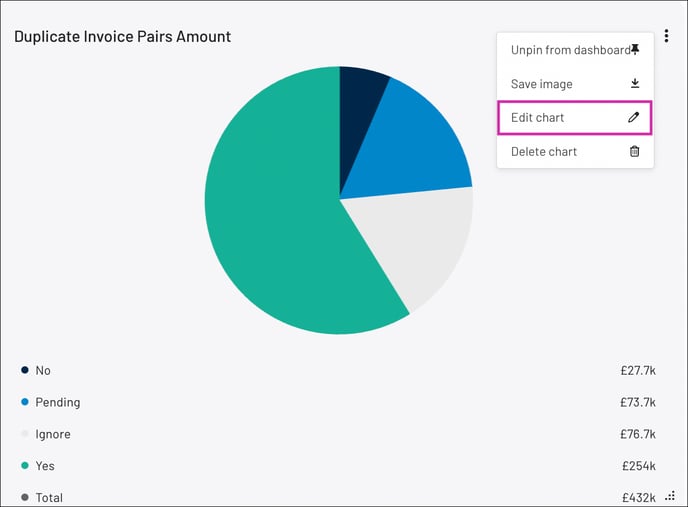
Chart reports include a chart/graph to visualise information in your account and a summary to describe the displayed information.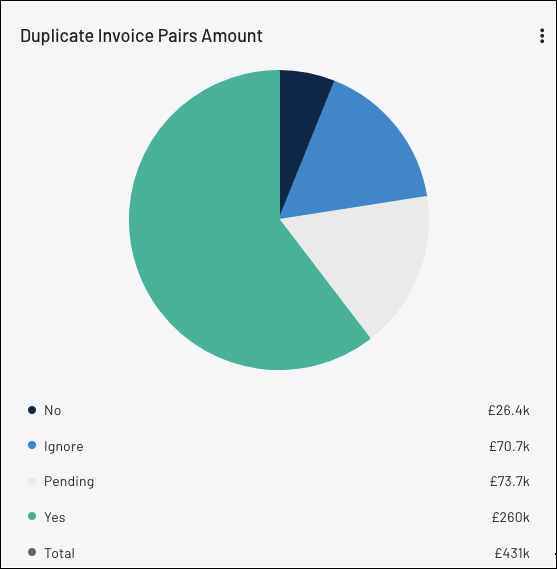
To open a filtered view of the Duplicate Invoices or Invoice Errors tab in a new browser tab, select a portion of the chart/graph.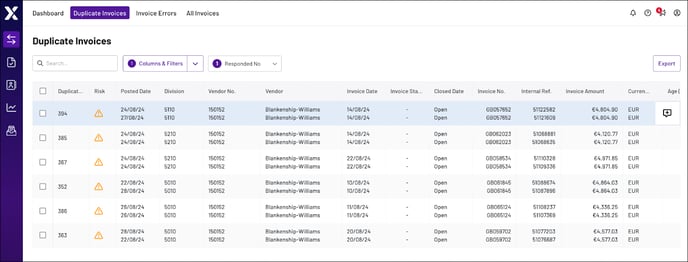
If you want to adjust a chart, click the more icon (three vertical dots) and select Edit chart. This opens the Report Builder, where you can customise reports for your dashboard. To learn more, see Create and Edit a Dashboard Report.