
When you navigate to the Reports module, you will land on the Reports dashboard, where you'll discover a range of pre-made charts already pinned, providing valuable information extracted from your invoicing data. These charts include Due Outgoings, Payment Performance (for more details, refer to the Payment Performance How-to Guide), Late Payments, and more.
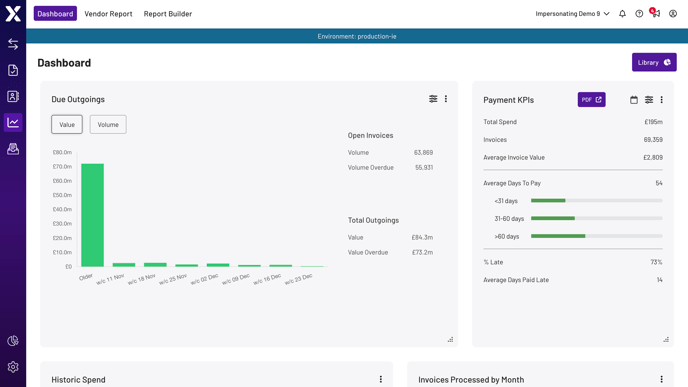
In the Reports Module, you will have the ability to customise reports and create new ones tailored to your specific needs. You can choose from different visualisation options, such as bar graphs, pie charts, or line charts, to best represent your data. Additionally, you can save these customised reports for future reference. Whether you are tracking financial performance, monitoring payment trends, or analysing overdue invoices, the Reports Module provides the tools necessary to transform your data into actionable insights. This article describes the following topics:
Customising the dashboard
The dashboard is personalised and unique to each user. Any changes made to your own dashboard will not affect other users' dashboards. You have the flexibility to pin or unpin charts to your dashboard by following these steps:
- Access your Library by clicking the corresponding icon located in the top right corner of the screen.
- Locate the chart you want to pin and click the three dots in the top right corner.
- Select 'Pin to...' and choose the desired dashboard, such as 'Pin to Reports Dashboard.'
Furthermore, you have the option to create your own custom charts and pin them to your dashboard. For detailed guidance on creating custom charts, please refer to the 'Creating Your Charts In Reports' section of this guide. If you need to share a report with other users in your company, kindly reach out to your designated Customer support, who will gladly assist you.
Creating your Chart In Reports
Go to the ‘Reports’ tab in the left sidebar of the screen.
Click on the 'Report Builder' page using the tab at the top.
Choose one of the four tabs based on the data you want to build a chart on:
- Invoices: Build a chart based on invoicing data or track data within the Protect module.
- Reconciliation: Build charts to track the progress of your reconciliations (only for Statement Reconciliation customers).
- Vendor: Build charts on the number of vendors added or amended over a specific timeframe.
- Email: Build a chart to show the number of invoices received in the inbox and the number of invoices with statements (only for Statement Reconciliation customers).
Once you have selected the desired tab, you can start building your chart.
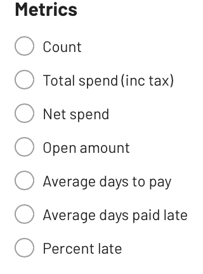
To build your chart you must select the metric you want to use from the available options within the specific tab. For example, in the Invoices tab, the metrics may include 'Count, 'Sum,' 'Average,' etc
Drag and drop fields into the Chart and Filters sections based on the chart you want to create.
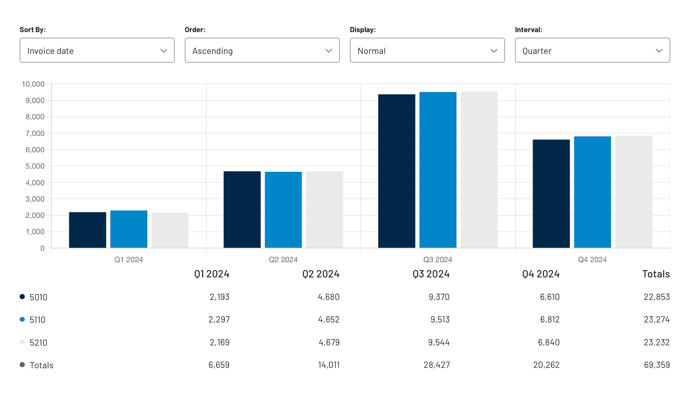
Example 1: Creating a chart showing the number of invoices per division within your company:
- Select the metric 'Count.'
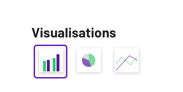
- Choose the Bar Chart visualisation.
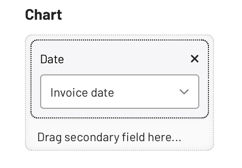
- Drag the 'Date' field into the Chart section.
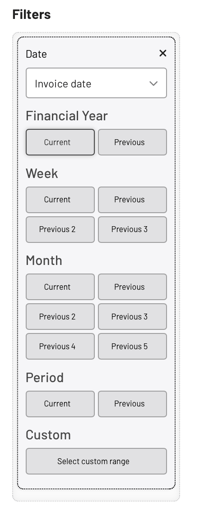
- (Optional) Also drag the 'Date' field into the Filters section to enable additional filtering options.
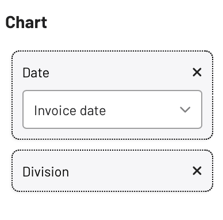
- Drag the 'Division' field into the Chart section as the secondary field.
- Customise the chart appearance using the options provided.
- Adjust the 'Date' field in the Filters section to view results for different timeframes.
- Once you are satisfied with your chart you have the option to rename your chart to a name of your choice.

- Click ' Save 'once you are satisfied with the chart name. This saves the chart to your Library.
💡If you need assistance building a specific chart or have any questions about the process, please don't hesitate to contact our customer support team and submit a ticket here. They are available to provide guidance and clarify whether your desired chart can be created.
Pinning Charts to Dashboards
-
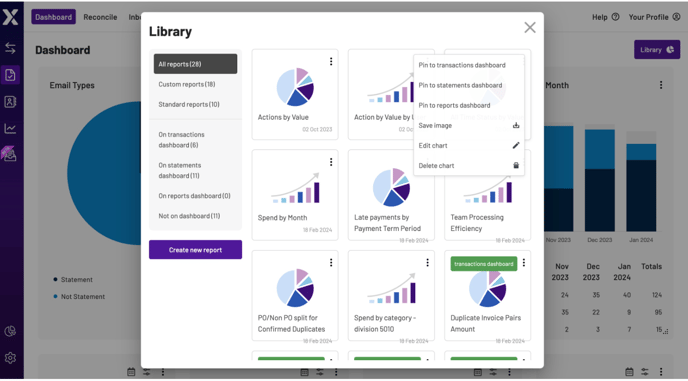
To pin the chart to your dashboard, go to your Library.
-
Click the three dots in the top right corner of the chart you want to pin.
-
Choose 'Pin to...' and select the dashboard where you want to pin the chart, such
as 'Pin to Reports Dashboard.'
-
You can also edit or delete the chart within your library as needed.